
An early view of inventory trends and changes
Foureyes public data visualizations provide snapshots into inventory levels, demand, and pricing trends for companies seeking timely, accurate automotive data. These views offer a taste of what’s possible with Foureyes inventory data.
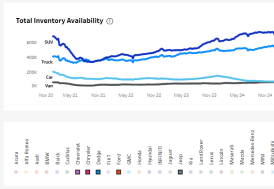
U.S. Auto Inventory Over Time
See how current trends are affecting supply. Review inventory level data across the US. Segment by brand, vehicle type, condition, and model to get the details that matter most to you.
See the data
U.S. Auto Inventory and Demand
See the interplay of inventory trends with demand for both the new and used markets. View demand indicators, including vehicle detail page (VDP) views, lead counts, and the leads required per sale, side-by-side with inventory, pricing, and discounts.
See the data

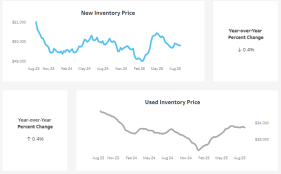
U.S. Automotive Prices Over Time
Review real-time pricing trends before they show up in government reports. Explore week-over-week or year-over-year changes across the market or within a specific auto brand.
See the data
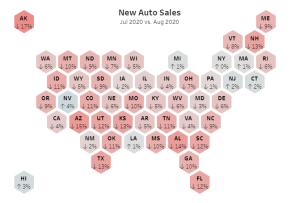
U.S. New Auto Sales and Market Share
In this data visualization, Foureyes shows monthly and year-over-year auto sales data for new inventory. Explore market share of sales by brand, body type, and state with year-over-year context.
See the data
Need more timely, structured data?


